
Almost 50 thousand advertisers in the mobile games space created new creatives in Q1 2023, accounting for 92.22% of the total number of advertisers, according to SocialPeta’s latest report.
In total, Q1 saw advertisers release over 7.8 million new creatives, representing 67.01% of all ad creatives.
Casual games ruled in terms of both the number of advertisers (29.16%, representing an increase of 2.29% from the same period in 2022) and the number of creatives (32.68%, a 12.33% year-on-year increase.) This highlights once again the strength of the genre.
Puzzle came in second place both in terms of proportion of advertisers (12.07%, a 0.26% year-on-year increase) and proportion of creatives (12.12%, a decrease of 1.91% compared to Q1 2022.) While simulation games came in third place in terms of the proportion of advertisers (9.55%, a 0.02% decrease), RPG pulled ahead in terms of the percentage of new creatives (9.01%).
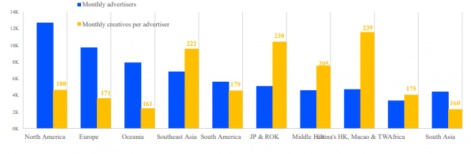
North America had the highest average monthly advertisers at 12.7 thousand, 30.6% higher than the number two region, Europe. Meanwhile Hong Kong, Macao, and Taiwan had the highest number of creatives per advertiser at 239, followed by Japan and South Korea (230) and Southeast Asia (222). In contrast, North American advertisers released an average of 180 creatives per month. This suggests that, while more advertisers are active in America, the higher levels of activity in other regions may be helping to bridge the gap.
Advertisers working on Android created an average of 245 creatives compared to 185 for Apple, a difference of 32.3%. SocialPeta notes that Q1 has consistently seen gains in the number of creatives in Q1 over the past three years.
Despite this, iOS ads had a higher number of impressions per creative (114.4 thousand) compared to Android (89.1 thousand). Board games emerged as the genre with the highest number of impressions per creative.
Video ads continued to be the most popular ad format, accounting for 82.97% of all creatives in Q1 2023. In contrast, Image ads, in second place, accounted for 13.56%, while playable ads made up just 2.17% of the total. All other ad formats accounted for a combined total of 1.30%.
This strong performance was echoed in the number of impressions garnered by video advertising’s percentage of impressions, making up 82.05% for the quarter. In contrast, image ads were responsible for 15.91% of all ad impressions in the same period. SocialPeta notes that this could represent the beginning of a downward trend, following consistent increases throughout 2022.
In February, SocialPeta examined the performance of the mobile advertising space throughout 2022.